
Interactive map: Western MA, Southcoast, Cape Ann home values push up as Metro Boston lags
Quincy/Braintree/Weymouth pocket of weakness

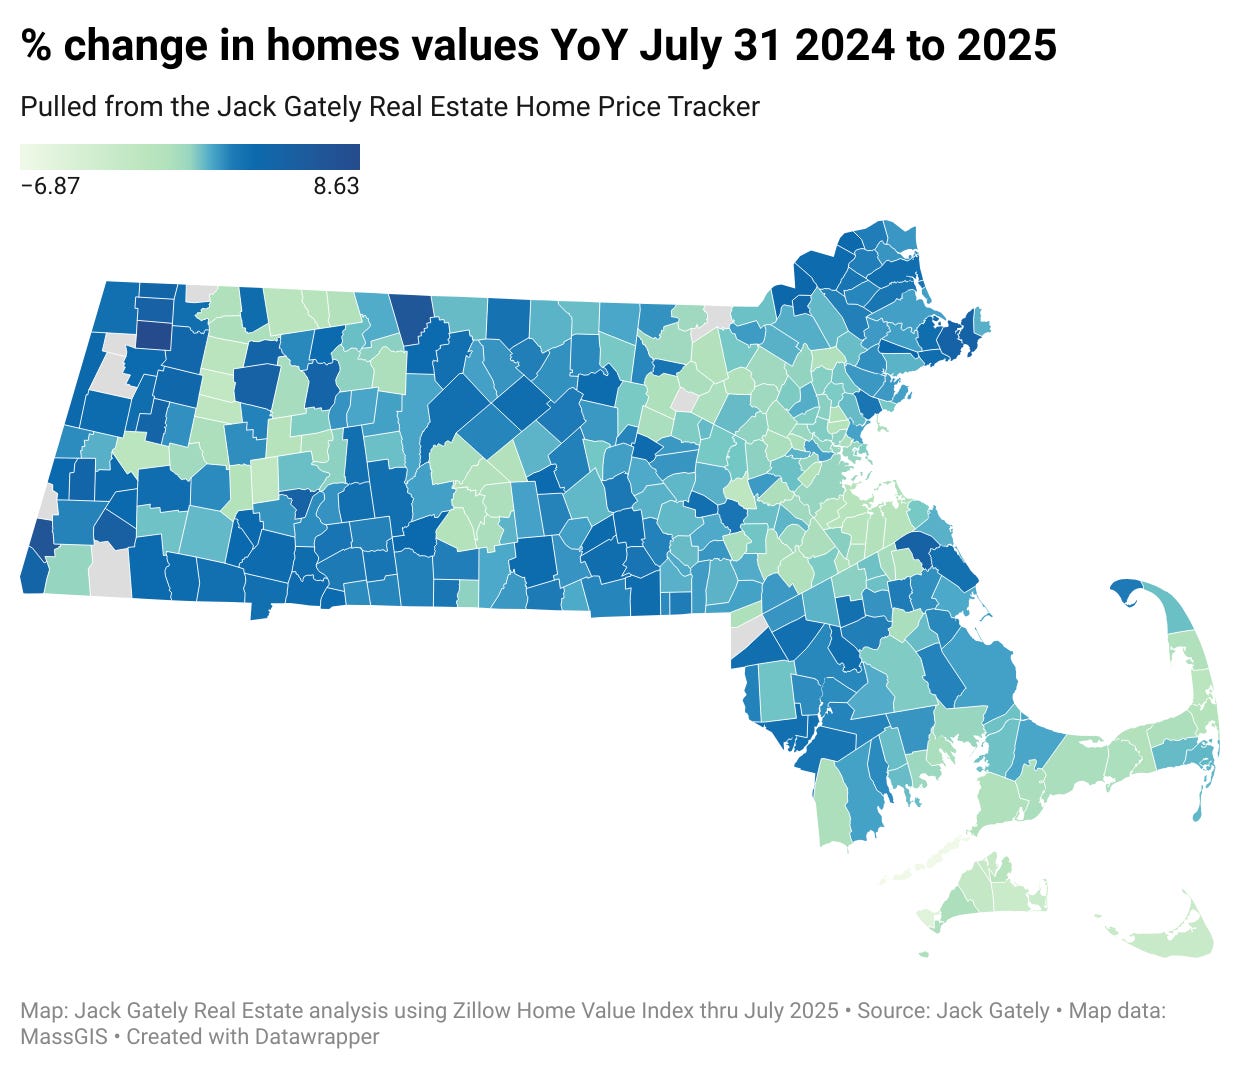
The price weakness seen in multiple markets across the country has begun to creep into the Massachusetts residential housing market, especially in the immediate metro Boston area, Cape Cod, and upper Middlesex County as values continued to appreciate year over year across most of western Massachusetts, the Southcoast and Cape Ann data show.
Use the interactive map below to check how your town did year over year.
Western Massachusetts towns such as Adams, Egremont, North Adams, Monterey, Easthampton and Warwick all saw values increase by at least 5% year over year.
Small sample size in smaller towns can skew data, the best practice is to identify trends across several municipalities (for instance Martha’s Vineyard).
Worcester County showed mixed results while greater Springfield along the Connecticut border and Cape Anne performed well compared to the statewide median.
But values near Boston stalled, slid or managed only slight gains.
Noticeably the South Shore towns of Milton, Braintree, Quincy, Weymouth, Hingham and Holbrook all lost value year over year. Avon held steady and Randolph gained just 1.05% in value.